3QFY2017 Result Update | Cable
February 7, 2017
KEI Industries
BUY
CMP
`167
Performance Highlights
Target Price
`207
Quarterly Data
Investment Period
12 Months
(` cr)
3QFY17
3QFY16
% yoy
2QFY17
% qoq
Revenue
716
559
28.1
624
14.7
Stock Info
EBITDA
78
61
27.9
67
16.9
Sector
Cable
Margin (%)
10.9
10.9
(1bp)
10.7
21bp
Market Cap (` cr)
1,300
Adj. PAT
27
15
82.9
23
18.7
Source: Company, Angel Research
Net Debt (` cr)
492
Beta
1.2
For 3QFY2017, KEI Industries (KEI) posted good set of results, exceeding our
52 Week High / Low
171/86
expectations on both, top-line as well as bottom-line fronts. Revenues grew by
Avg. Daily Volume
1,33,233
~28% yoy (above our estimate), however, the company reported flat operating
margins. On the bottom-line front, KEI reported growth of ~83% yoy to `27cr on
Face Value (`)
2
the back of strong top-line growth and lower taxes.
BSE Sensex
28,241
Nifty
8,741
Top-line driven by strong growth in Turnkey Projects: The company’s top-line
Reuters Code
KEIN.BO
grew by ~28% yoy to `716cr (above our estimate) on the back of strong growth
Bloomberg Code
KEII.IN
in Turnkey Projects (up ~40% to `247cr) as well as exports. However, we saw
flattish growth in other segments like Cables (up 2% yoy to ~`181cr) and
Stainless Steel Wire (no yoy growth recorded at ~`24cr).
Shareholding Pattern (%)
Strong revenue growth and lower taxes boost overall profitability: On the
Promoters
49.0
operating front, the company’s margin remained flat at 10.9%. The company
MF / Banks / Indian Fls
18.6
reported ~83% yoy rise in its net profit to `27cr on the back of strong revenue
FII / NRIs / OCBs
5.8
growth and lower taxes.
Indian Public / Others
26.6
Outlook and Valuation: We expect KEI to report net revenue CAGR of ~14% to
~`3,455cr over FY2016-19E mainly due to (a) higher order book execution in
EPC segment; (b) growth in EHV business; (c) higher B2C sales; and (d) higher
Abs.(%)
3m
1yr
3yr
exports. On the bottom-line front, we expect a CAGR of ~26% to `123cr over the
Sensex
3.0
16.6
39.7
same period on the back strong revenue and lower interest costs. At the CMP of
KEI
42.8
42.8
1304.5
`168, the stock trades at 10.5x its FY2019E EPS of `15.9. Thus, we maintain our
Buy rating with the Target Price of `207.
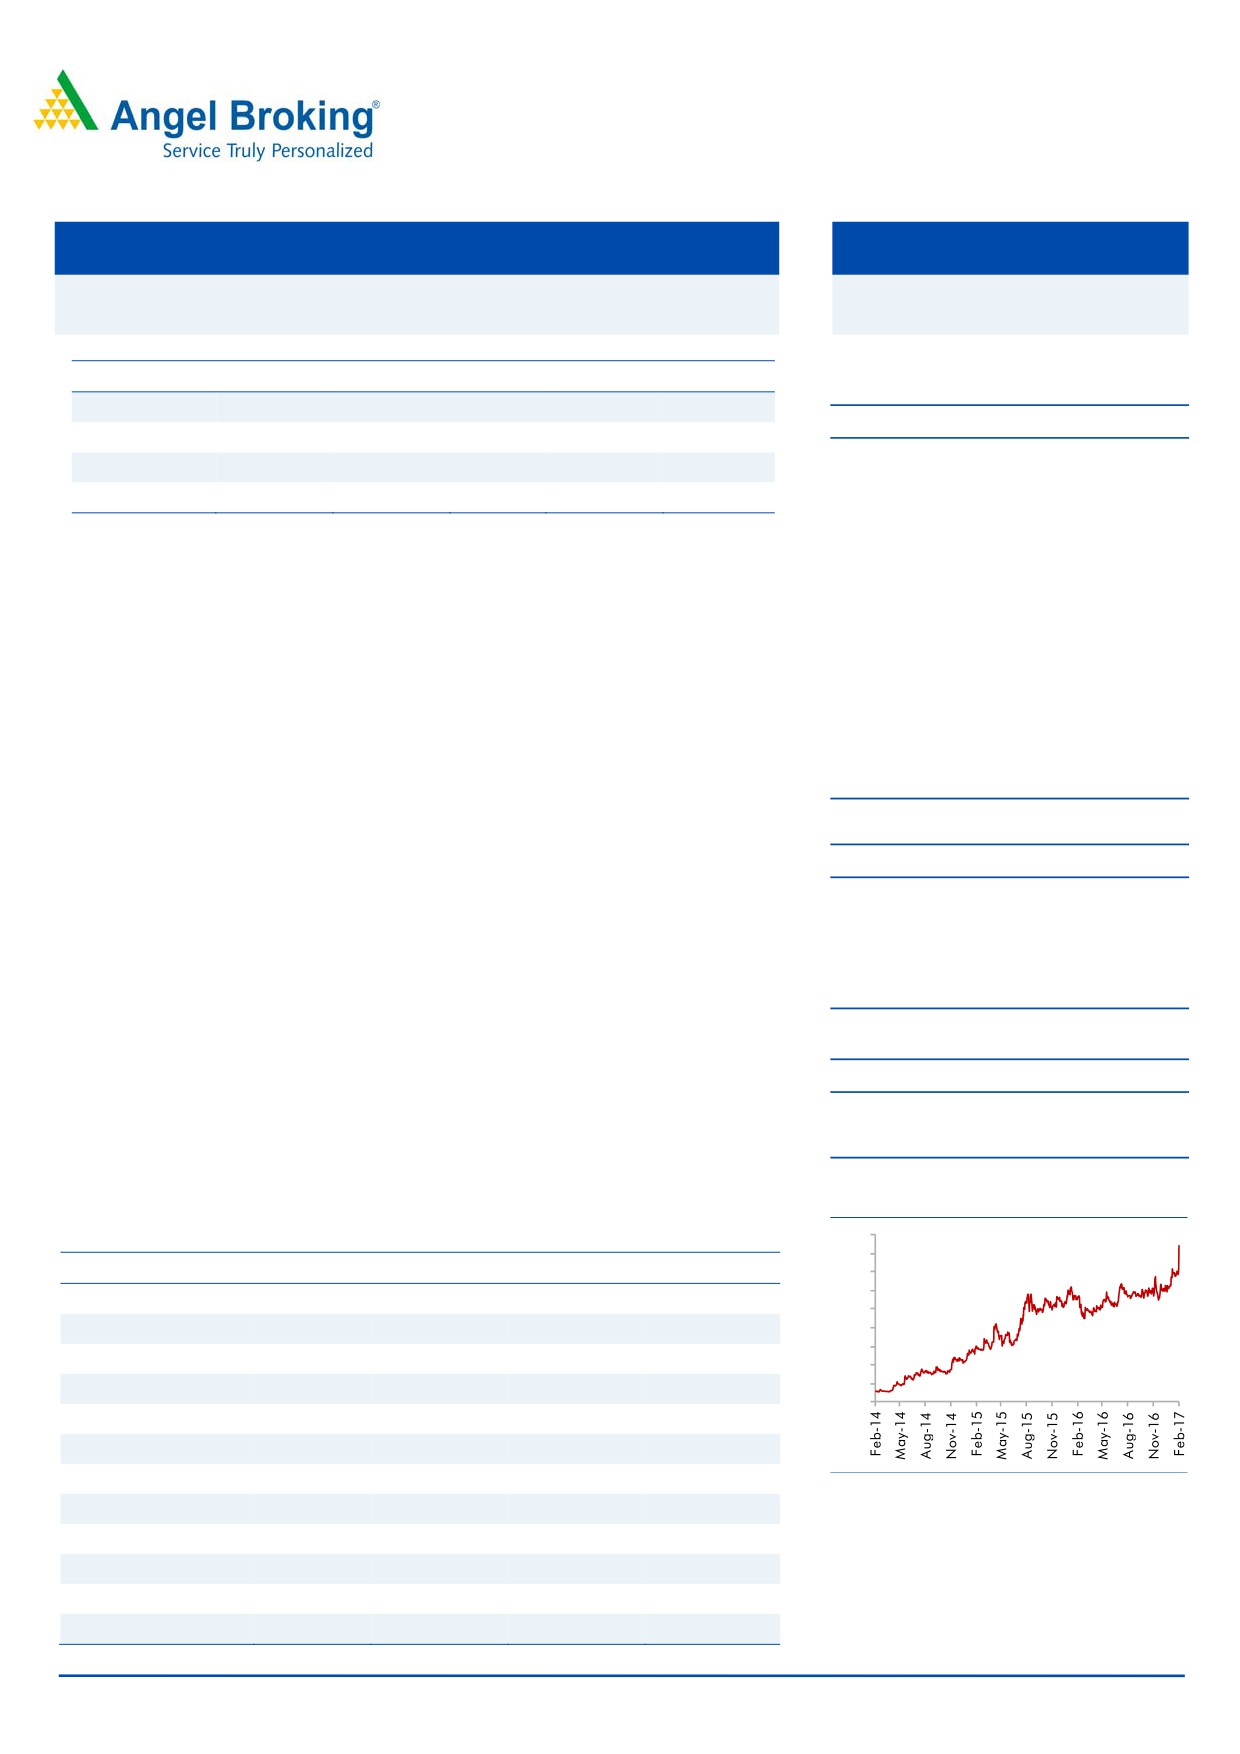
3-year price chart
180
Key financials
160
Y/E March (` cr)
FY2016
FY2017E
FY2018E
FY2019E
140
120
Net sales
2,326
2,682
3,058
3,455
100
% chg
14.5
15.3
14.0
13.0
80
60
Net profit
62
91
99
123
40
20
% chg
91.0
46.6
8.5
24.3
0
EBITDA margin (%)
10.4
10.4
10.0
10.0
EPS (`)
8.1
11.8
12.8
15.9
P/E (x)
20.9
14.2
13.1
10.5
Source: Company, Angel Research
P/BV (x)
3.5
2.9
2.4
2.0
RoE (%)
17.0
20.2
18.2
18.7
RoCE (%)
25.1
25.0
24.9
25.6
Amarjeet S Maurya
EV/Sales (x)
0.8
0.7
0.6
0.5
022-39357800 Ext: 6831
EV/EBITDA (x)
7.4
6.5
6.0
5.3
Source: Company, Angel Research, Note: CMP as of February 6, 2017
Please refer to important disclosures at the end of this report
1
KEI Industries | 3QFY2017 Result Update
Exhibit 1: Quarterly performance
Y/E March (` cr)
3QFY17
3QFY16
% yoy
2QFY17
% qoq
9MFY17
9MFY16
% chg
Net Sales
716
559
28.1
624
14.7
1,891
1,689
12.0
Consumption of RM
483
369
30.9
434
11.5
1,289
1,171
10.0
(% of Sales)
67.5
66.0
69.4
68.1
69.3
Staff Costs
29
22
29.1
26
9.5
80
60
33.0
(% of Sales)
4.0
4.0
4.2
4.2
3.6
Other Expenses
126
107
18.2
98
28.9
322
283
13.7
(% of Sales)
17.6
19.1
15.7
17.0
16.8
Total Expenditure
638
498
28.1
558
14.4
1,691
1,514
11.6
Operating Profit
78
61
27.9
67
16.9
201
175
14.9
OPM
10.9
10.9
10.7
10.6
10.3
Interest
34.1
32
4.9
31.8
7.3
93
96
(3.5)
Depreciation
7.0
6
10.0
6.5
7.8
20
19
9.5
Other Income
0
1
2
3
3
PBT (excl. Ext Items)
37
23
58.9
30
22.7
91
63
44.7
Ext (Income)/Expense
PBT (incl. Ext Items)
37
23
58.9
30
22.7
91
63
44.7
(% of Sales)
5.2
4.2
4.8
4.8
3.7
Provision for Taxation
10
8
7
24
21
14.3
(% of PBT)
26.7
36.4
24.2
26
33
Reported PAT
27
15
82.9
23
18.7
67
42
59.9
PATM
3.8
2.7
3.7
3.5
2.5
Reported PAT
27
15
82.9
22.90
18.7
67
42
59.9
Equity shares (cr)
7.7
7.7
8
7.7
7.7
FDEPS (`)
3.5
1.9
82.9
2.9
19.5
8.7
5.4
59.9
Source: Company, Angel Research
February 7, 2017
2
KEI Industries | 3QFY2017 Result Update
Key investment arguments
Healthy order book indicates strong revenue visibility
KEI’s current order book stands at `3,233cr (of which cables account for about
`613cr of orders; `236cr orders are from EHV segment; exports are around
`110cr and the remaining orders are from EPC segment). Its order book grew by
~28% in the last 3 years on the back of order inflows from State Electricity Boards,
Power Grid, etc. This gives KEI a revenue visibility for the next 12-16 months.
Strong distribution network and higher ad spends to boost B2C business
KEI’s consistent effort to increase its retail business from 30% of revenue in FY2016
to 40-45% of revenue in the next 2-3 years on the back of strengthening
distribution network (currently 926, which is expect to increase to 1,500 by
FY2019) and higher ad spends (increased from `2cr in FY2013 to `7cr in FY2016
and expected to increase further).
Exports to continue its growth momentum
KEI’s exports (8% of revenue in FY2016) is expected to reach a level of 14-15% in
next two years on the back of higher order execution from current order book of
~`180cr and participation in various international tenders worth `500cr. We
expect a strong ~26% growth CAGR over FY2016-19 in exports.
Interest cost as % of net sales to decline by 150bp over FY2016-19
We expect the company’s interest cost to decline due to (1) full repayment of its
`211cr term loan in next 2-3 years, and (2) marginally lower interest cost expected
due to the improvement in credit rating. While the company may see some rise in
its working capital requirement due to higher sales in EPC segment, the debt
repayment and low interest rate should offset the same. Due to this, we expect
interest cost to decline as % of sales, which will further result in better profitability.
February 7, 2017
3
KEI Industries | 3QFY2017 Result Update
Outlook and Valuation
We expect KEI to report net revenue CAGR of
~14% to ~`3,455cr over
FY2016-19E mainly due to (a) higher order book execution in EPC segment;
(b) growth in EHV business; (c) higher B2C sales; and (d) higher exports. On the
bottom-line front, we expect a CAGR of ~26% to `123cr over the same period on
the back strong revenue and lower interest costs. At the CMP of `167, the stock
trades at 10.5x its FY2019E EPS of `15.9. Thus, we maintain our Buy rating with
the Target Price of `207.
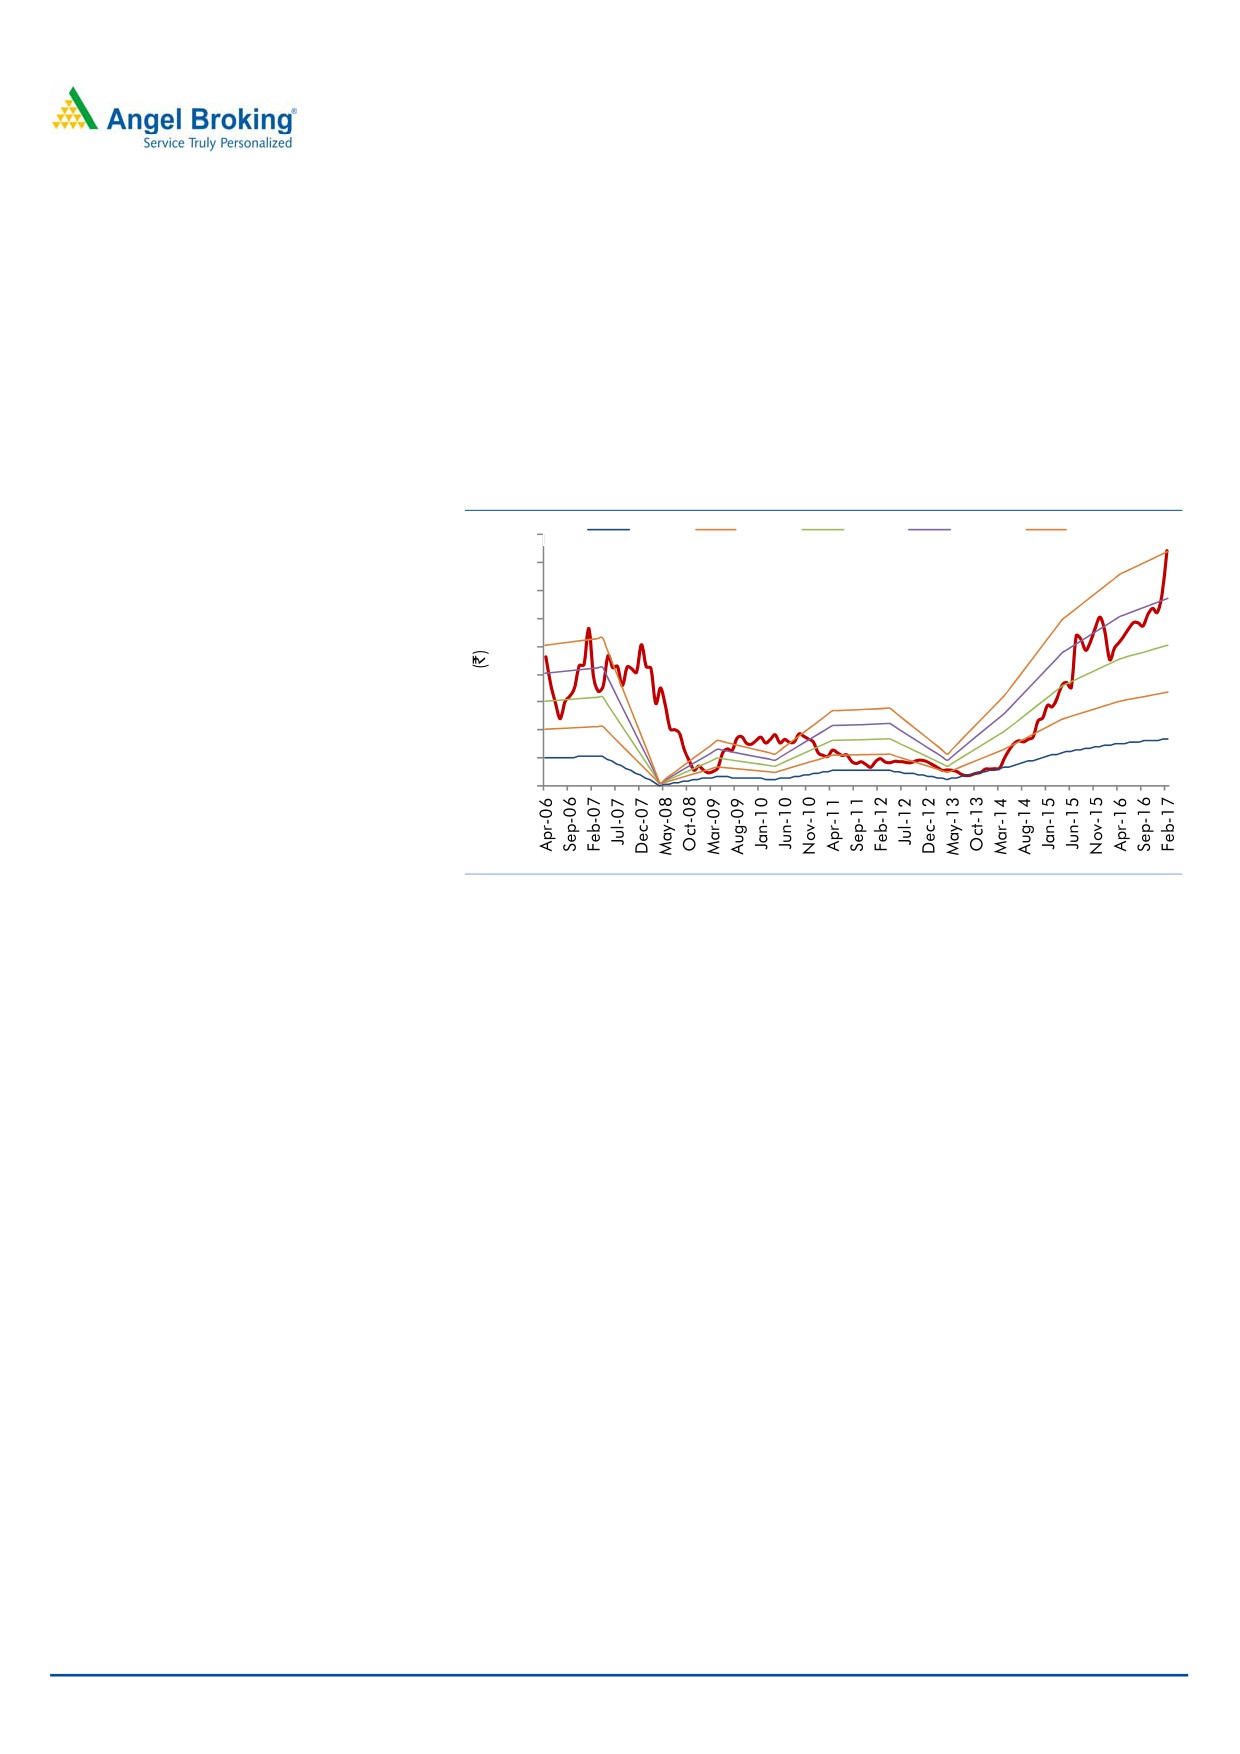
Exhibit 2: One year forward PE Chart
180
3x
6x
9x
12x
15x
160
140
120
100
80
60
40
20
0
Source: Company, Angel Research
Downside risks to our estimates
KEI’s EPC segment contributes ~14% in the total revenue. This segment
primarily depends upon government spending and any delay in investment by
the government may lead to reduction in order book and would impact its
revenue.
Any unfavorable change in the prices of commodities, forex and interest rates,
and delay in project execution can hurt its profitability.
February 7, 2017
4
KEI Industries | 3QFY2017 Result Update
Company Background
KEI Industries Limited (KEI) is a cable manufacturing company, engaged in
manufacture and supply of power and other industrial cables. The Company is
also engaged in Engineering, Procurement and Construction (EPC) business. It
operates through Cables and Turnkey Projects segments and has its manufacturing
facilities at Bhiwadi & Chopanki in Rajastahn and Silvassa in Dadra and Nagar
Haveli.
The cables segment comprises of a whole range of cables such as Extra High
Voltage (EHV), High tension (HT) and low tension (LT) power cables, control and
instrumentation cables, winding wires, flexible wires, and house and stainless steel
wires. Their products are supplied to various sectors like oil refineries, railways,
automobiles, cement, steel, fertilizers, textile and real estate sectors.
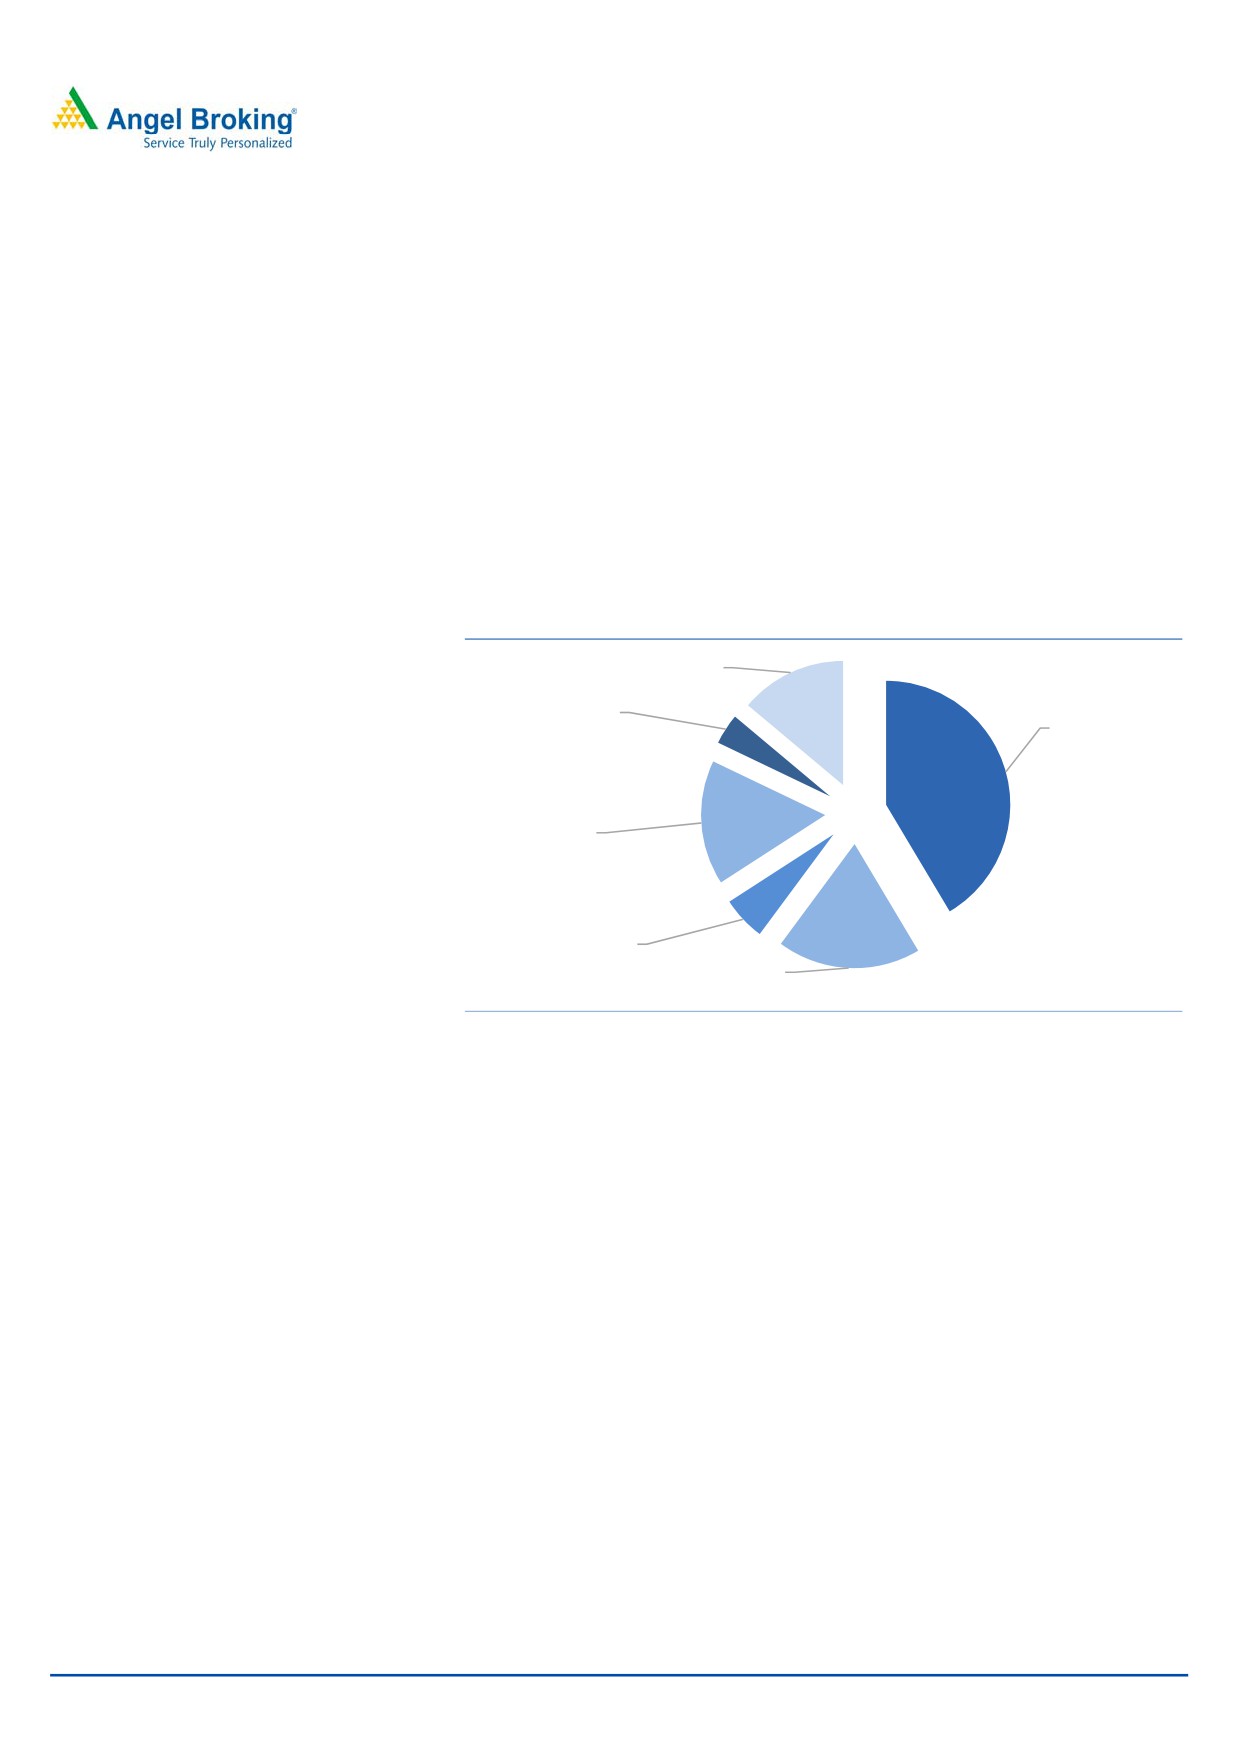
Exhibit 3: Historical revenue mix
Turnkey Projects,
14%
Stainless Steel
LT Power /
Wire, 4%
Rubber cable,
41%
HW, WW &
Flexible wire,
16%
EHV cable, 6%
HT Power casble,
19%
Source: Company, Angel Research
February 7, 2017
5
KEI Industries | 3QFY2017 Result Update
Profit & Loss Statement
Y/E March (` cr)
FY2015
FY2016
FY2017E
FY2018E
FY2019E
Total operating income
2,031
2,326
2,682
3,058
3,455
% chg
25.5
14.5
15.3
14.0
13.0
Total Expenditure
1,838
2,083
2,403
2,752
3,110
Raw Material
1,477
1,615
1,872
2,146
2,439
Personnel
62
83
102
122
145
Others Expenses
299
386
429
483
525
EBITDA
193
242
279
306
346
% chg
26.0
25.6
15.1
9.6
13.0
(% of Net Sales)
9.5
10.4
10.4
10.0
10.0
Depreciation& Amortisation
25
25
29
30
32
EBIT
168
217
250
275
314
% chg
27.4
28.9
15.3
10.1
14.0
(% of Net Sales)
8.3
9.3
9.3
9.0
9.1
Interest & other Charges
120
127
128
133
136
Other Income
5
5
5
6
6
(% of PBT)
9.4
5.6
3.6
3.7
3.0
Share in profit of Associates
-
-
-
-
-
Recurring PBT
53
95
127
148
184
% chg
142.3
80.3
32.9
16.6
24.3
Tax
19
33
35
49
61
(% of PBT)
35.2
34.8
28.0
33.0
33.0
PAT (reported)
34
62
91
99
123
Extraordinary Items
2
-
-
-
-
ADJ. PAT
33
62
91
99
123
% chg
180.7
91.0
46.6
8.5
24.3
(% of Net Sales)
1.6
2.7
3.4
3.2
3.6
Basic EPS (`)
4.2
8.1
11.8
12.8
15.9
Fully Diluted EPS (`)
4.2
8.1
11.8
12.8
15.9
% chg
180.7
91.0
46.6
8.5
24.3
February 7, 2017
6
KEI Industries | 3QFY2017 Result Update
Balance Sheet
Y/E March (` cr)
FY2015
FY2016
FY2017E FY2018E FY2019E
SOURCES OF FUNDS
Equity Share Capital
15
15
15
15
15
Reserves& Surplus
288
351
437
529
642
Shareholders Funds
304
367
452
544
658
Minority Interest
-
-
-
-
-
Total Loans
453
498
547
563
568
Deferred Tax Liability
39
40
40
40
40
Total Liabilities
796
905
1,040
1,148
1,266
APPLICATION OF FUNDS
Gross Block
445
500
544
559
589
Less: Acc. Depreciation
147
172
200
231
262
Net Block
298
328
344
328
327
Capital Work-in-Progress
4
29
-
-
-
Investments
3
3
3
3
3
Current Assets
1,036
1,127
1,318
1,552
1,778
Inventories
440
422
500
578
663
Sundry Debtors
480
567
661
771
880
Cash
5
6
17
19
28
Loans & Advances
106
109
113
153
173
Other Assets
5
22
27
31
35
Current liabilities
562
586
629
739
846
Net Current Assets
474
541
689
813
932
Deferred Tax Asset
16
4
4
4
4
Mis. Exp. not written off
-
-
-
-
-
Total Assets
796
905
1,040
1,148
1,266
February 7, 2017
7
KEI Industries | 3QFY2017 Result Update
Cashflow Statement
Y/E March (` cr)
FY2015
FY2016
FY2017E FY2018E FY2019E
Profit before tax
53
95
127
148
184
Depreciation
25
25
29
30
32
Change in Working Capital
5
(51)
(137)
(122)
(111)
Interest / Dividend (Net)
120
127
128
133
136
Direct taxes paid
(9)
(20)
(35)
(49)
(61)
Others
5
8
0
0
0
Cash Flow from Operations
198
185
111
141
179
(Inc.)/ Dec. in Fixed Assets
(17)
(98)
(44)
(15)
(30)
(Inc.)/ Dec. in Investments
0
0
29
0
0
Cash Flow from Investing
(17)
(98)
(15)
(15)
(30)
Issue of Equity
0
0
0
0
0
Inc./(Dec.) in loans
44
92
49
16
5
Dividend Paid (Incl. Tax)
(2)
(3)
(5)
(7)
(10)
Interest / Dividend (Net)
(224)
(175)
(128)
(133)
(136)
Cash Flow from Financing
(181)
(87)
(85)
(124)
(141)
Inc./(Dec.) in Cash
0
1
11
2
9
Opening Cash balances
5
5
6
17
19
Closing Cash balances
5
6
17
19
28
February 7, 2017
8
KEI Industries | 3QFY2017 Result Update
Key ratios
Y/E March
FY2015
FY2016
FY2017E FY2018E FY2019E
Valuation Ratio (x)
P/E (on FDEPS)
39.9
20.9
14.2
13.1
10.5
P/CEPS
22.1
14.8
10.8
10.0
8.4
P/BV
4.3
3.5
2.9
2.4
2.0
Dividend yield (%)
0.2
0.3
0.4
0.5
0.8
EV/Sales
0.9
0.8
0.7
0.6
0.5
EV/EBITDA
9.0
7.4
6.5
6.0
5.3
EV / Total Assets
2.2
2.0
1.8
1.6
1.4
Per Share Data (`)
EPS (Basic)
4.2
8.1
11.8
12.8
15.9
EPS (fully diluted)
4.2
8.1
11.8
12.8
15.9
Cash EPS
7.6
11.3
15.5
16.7
20.0
DPS
0.4
0.5
0.7
0.9
1.3
Book Value
39.3
47.5
58.6
70.5
85.1
Returns (%)
ROCE
22.2
25.1
25.0
24.9
25.6
Angel ROIC (Pre-tax)
22.5
25.4
25.6
25.4
26.3
ROE
10.7
17.0
20.2
18.2
18.7
Turnover ratios (x)
Asset Turnover (Gross Block)
4.6
4.7
4.9
5.5
5.9
Inventory / Sales (days)
79
66
68
69
70
Receivables (days)
86
89
90
92
93
Payables (days)
40
41
41
41
41
WC cycle (ex-cash) (days)
126
115
117
120
122
February 7, 2017
9
KEI Industries | 3QFY2017 Result Update
Research Team Tel: 022 - 39357800
DISCLAIMER
Angel Broking Private Limited (hereinafter referred to as “Angel”) is a registered Member of National Stock Exchange of India Limited,
Bombay Stock Exchange Limited and Metropolitan Stock Exchange Limited. It is also registered as a Depository Participant with CDSL
and Portfolio Manager with SEBI. It also has registration with AMFI as a Mutual Fund Distributor. Angel Broking Private Limited is a
registered entity with SEBI for Research Analyst in terms of SEBI (Research Analyst) Regulations, 2014 vide registration number
INH000000164. Angel or its associates has not been debarred/ suspended by SEBI or any other regulatory authority for accessing
/dealing in securities Market. Angel or its associates/analyst has not received any compensation / managed or co-managed public
offering of securities of the company covered by Analyst during the past twelve months.
This document is solely for the personal information of the recipient, and must not be singularly used as the basis of any investment
decision. Nothing in this document should be construed as investment or financial advice. Each recipient of this document should
make such investigations as they deem necessary to arrive at an independent evaluation of an investment in the securities of the
companies referred to in this document (including the merits and risks involved), and should consult their own advisors to determine
the merits and risks of such an investment.
Reports based on technical and derivative analysis center on studying charts of a stock's price movement, outstanding positions and
trading volume, as opposed to focusing on a company's fundamentals and, as such, may not match with a report on a company's
fundamentals. Investors are advised to refer the Fundamental and Technical Research Reports available on our website to evaluate the
contrary view, if any.
The information in this document has been printed on the basis of publicly available information, internal data and other reliable
sources believed to be true, but we do not represent that it is accurate or complete and it should not be relied on as such, as this
document is for general guidance only. Angel Broking Pvt. Limited or any of its affiliates/ group companies shall not be in any way
responsible for any loss or damage that may arise to any person from any inadvertent error in the information contained in this report.
Angel Broking Pvt. Limited has not independently verified all the information contained within this document. Accordingly, we cannot
testify, nor make any representation or warranty, express or implied, to the accuracy, contents or data contained within this document.
While Angel Broking Pvt. Limited endeavors to update on a reasonable basis the information discussed in this material, there may be
regulatory, compliance, or other reasons that prevent us from doing so.
This document is being supplied to you solely for your information, and its contents, information or data may not be reproduced,
redistributed or passed on, directly or indirectly.
Neither Angel Broking Pvt. Limited, nor its directors, employees or affiliates shall be liable for any loss or damage that may arise from
or in connection with the use of this information.
Disclosure of Interest Statement
KEI Industries
1. Financial interest of research analyst or Angel or his Associate or his relative
No
2. Ownership of 1% or more of the stock by research analyst or Angel or associates or relatives
No
3. Served as an officer, director or employee of the company covered under Research
No
4. Broking relationship with company covered under Research
No
Ratings (Based on expected returns
Buy (> 15%)
Accumulate (5% to 15%)
Neutral (-5 to 5%)
over 12 months investment period):
Reduce (-5% to -15%)
Sell (< -15)
February 7, 2017
10